
We put prices on almost everything around us, but rarely stop to ask what those prices actually contain. A building is more than concrete and steel; it is hours, hands, expertise, and effort, all compressed into the space around us. A square metre may be one of the simplest measurements in construction, but its human cost can vary dramatically depending on where in the world it is built.
To put a human scale on property prices, the team at RationalFX combined residential property prices per square metre with average salaries around the world. The analysis asks two simple questions: how long would an average worker have to work to earn enough for one square metre, and how much space could one monthly salary buy? We then translated those figures into familiar everyday spaces – such as a small bathroom, a washing machine, or a compact dining table – to show what those numbers actually mean in physical terms.
A month of work can buy surprisingly little space in much of the world. In 62 of the 100 countries analysed, an average monthly net salary covers less than half a square metre of residential property. In Nigeria, it buys just 0.04 m² – roughly the footprint of a small plate – while in Cuba, Sri Lanka and Hong Kong, it covers less than 0.15 m².
At the other end of the scale, a monthly salary stretches to more than one square metre in just three countries: South Africa, Oman, and the United States, highlighting just how differently the value of a month’s work translates into physical space around the world.
Key Takeaways:
- The physical reality of a monthly salary changes dramatically around the world: 1.61 m² in South Africa versus just 0.435 m² in Nigeria means the same month of work buys more than 37 times more space in one country than the other.
- A high salary can still leave you short on space: Switzerland’s $7,273 monthly pay buys only 0.44 m², while Singapore’s $4,212 buys just 0.21 m².
- Europe’s wealthier markets often give workers surprisingly little space. A monthly salary buys 0.81 m² in Ireland, 0.74 m² in Denmark, 0.70 m² in Norway and 0.65 m² in Germany, despite all four having relatively high average net salaries.
- The same monthly salary can buy wildly different everyday spaces: in the US, it is enough for a small pantry (1.46 m²), while in Japan, it shrinks to an office chair (0.45 m²), and in Egypt, to a small bathroom mirror (0.25 m²).
Residential Property Prices Per Square Metre Around The World
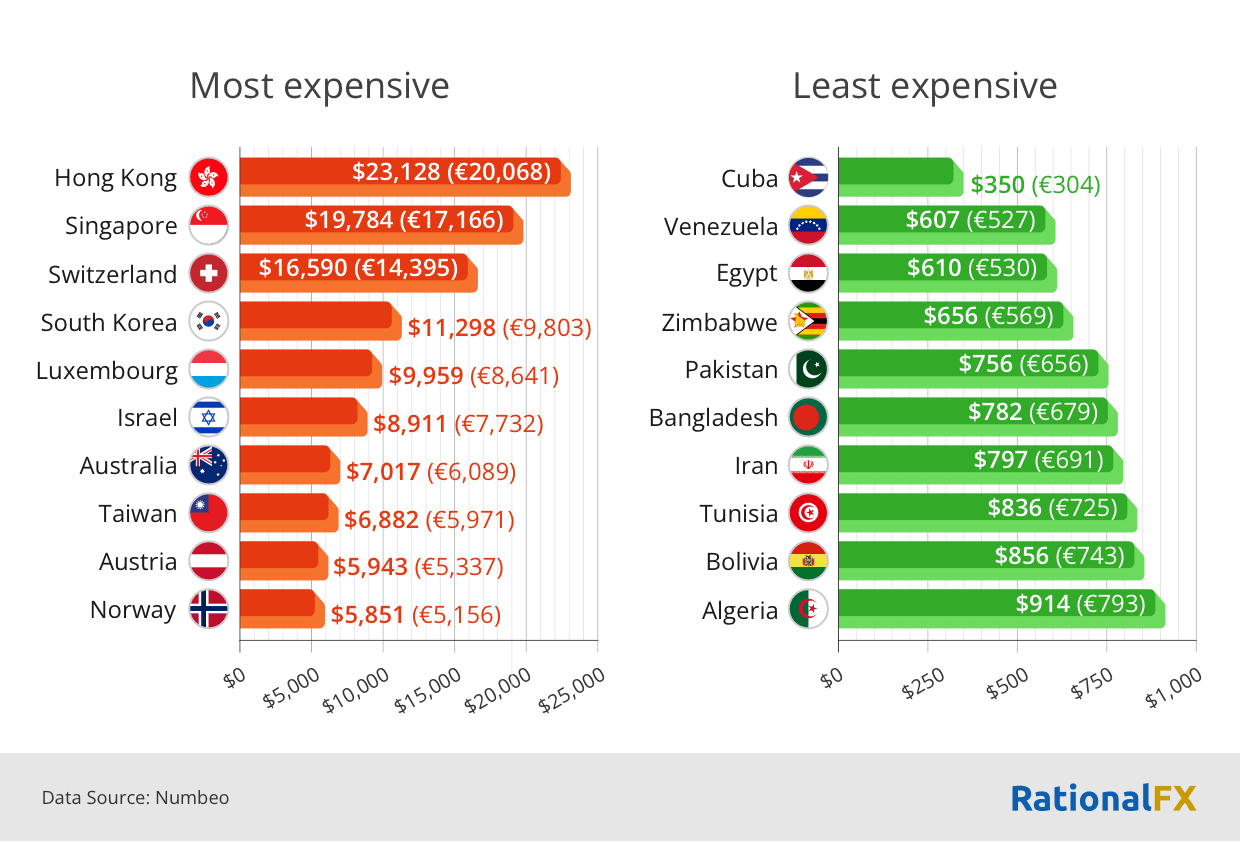
The global property map has some counterintuitive extremes. In Hong Kong, the average square metre costs $23,128, meaning that a 60 m² apartment would carry a theoretical average property price of almost $1.4 million before considering other costs. Singapore follows at $19,784 per m², while Switzerland reaches $16,590. These are not simply expensive homes; they are markets where floor space itself has become a premium commodity. A few dozen extra square metres can add hundreds of thousands of dollars to a property’s price, making the size of a home almost as consequential as its location.
At the opposite end, the numbers almost seem to belong to another property market altogether. A square metre averages just $350 in Cuba, $607 in Venezuela, and $610 in Egypt – less than the price of many everyday consumer purchases in wealthier markets. But the low sticker price should not be mistaken for easy homeownership: as the earlier figures show, what matters is not merely what a square metre costs, but what that price represents relative to local earnings. A cheap square metre can still be painfully expensive when measured against the pay cheque of the person trying to buy it.
How Many Days of Work Does It Take to Buy 1 sq. m. of Property?
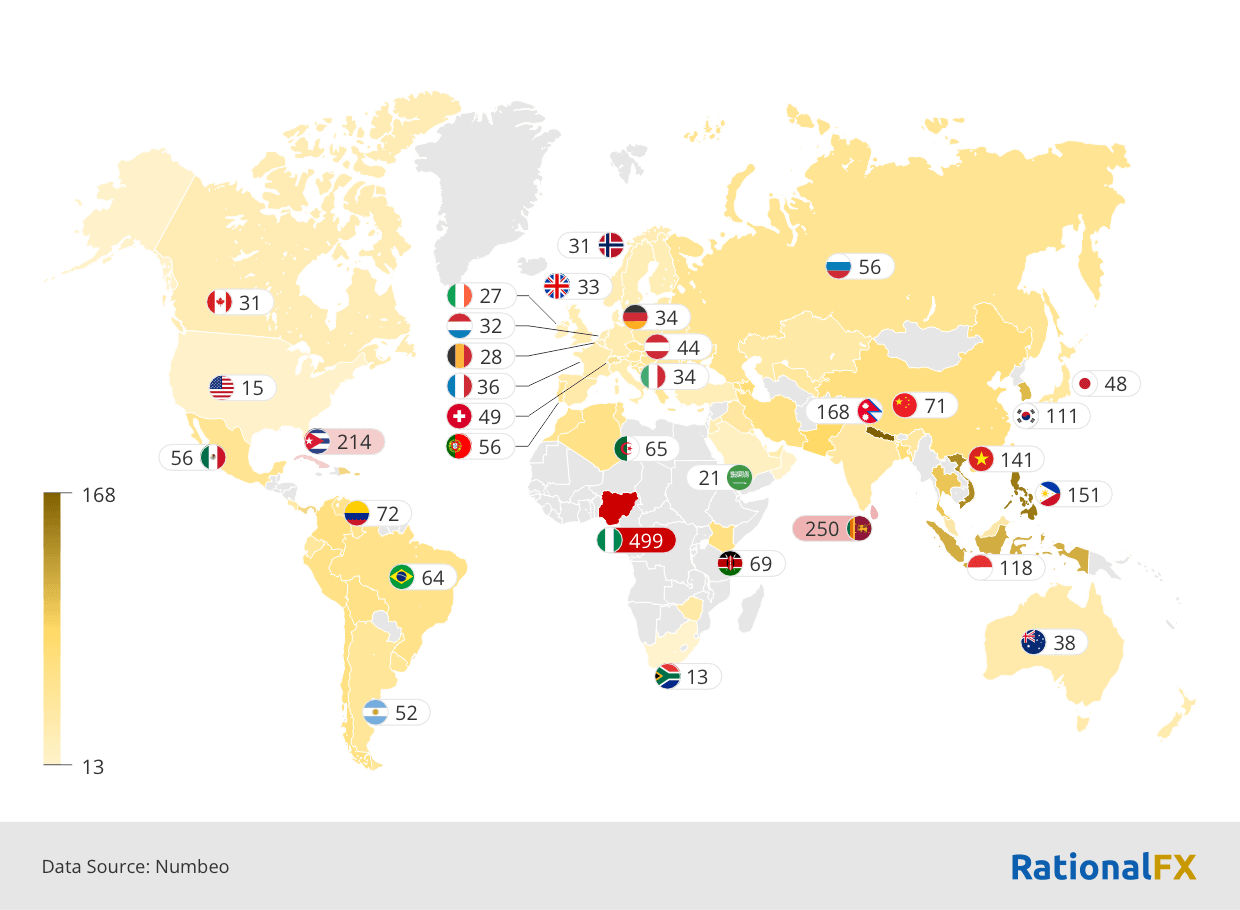
The price of a square metre can be thought of as a slice of working life. Across the 100 countries analysed, that slice ranges from 13.46 working days in South Africa to 498.91 days in Nigeria – from less than a month of work to well over a year. A square metre is hardly a home or even a room; it is closer to the footprint of a small dining table, a wardrobe, or a couple of armchairs. Yet in Bulgaria, it takes 36.15 working days to earn that patch of floor, while in Japan, it takes 47.72 days. Suddenly, a figure on a property listing becomes something much easier to feel: weeks of busy mornings, long commutes, and eight-hour working days.
Seen this way, property prices are not only measured in dollars or euros, but in pieces of the calendar. A worker is effectively trading time for space, with every additional square metre demanding another slice of a finite working life. In Poland, for example, one square metre costs 42.17 working days, compared with 49.50 days in Switzerland. The numbers reveal a side of housing affordability that price tags alone cannot capture: how much of a person’s working life must be spent before a small piece of the world can finally become theirs.
Countries Where You Need To Work The Least to Buy 1 Square Metre Of Property
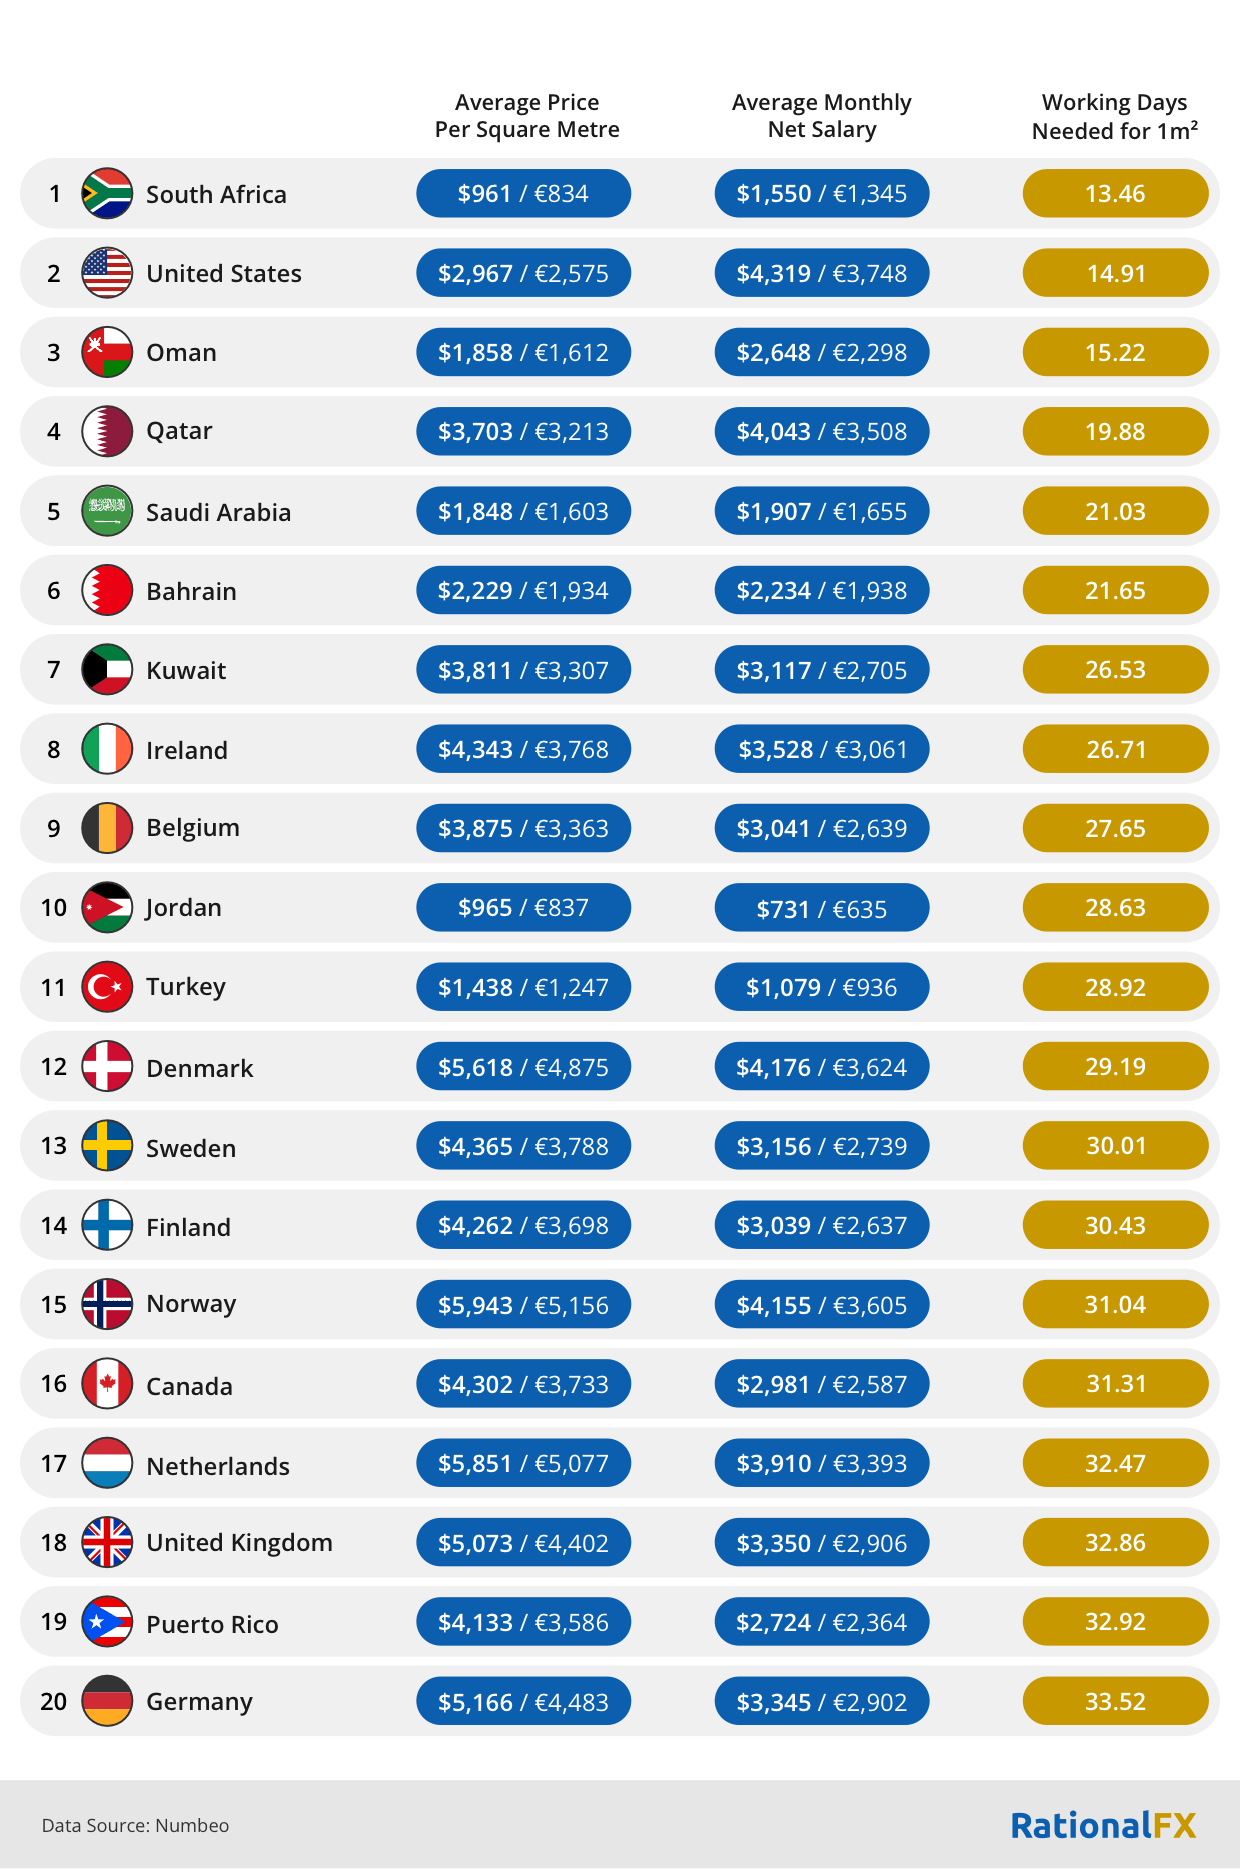
The countries at the top of the ranking show that housing affordability is not simply a race to the lowest property prices. South Africa comes first with an average price of $961 per m², but the United States follows despite homes averaging almost three times as much, because its average monthly net salary is also far higher. Oman tells a similar story: at $1,858 per m², its property is nearly twice as expensive as South Africa’s, yet workers need only 15.22 days to earn a square metre. In other words, a higher price tag can become surprisingly light when placed against a sufficiently large pay packet.
Further down, this is even more obvious. Denmark, Norway, and the Netherlands all have average property prices above $5,600 per m², yet their workers need over 30 working days to earn one square metre. The ranking therefore tells a different story from a conventional house-price league table: what matters is not how expensive the bricks are, but how many working days it takes to pay for them. A $5,000 square metre can be more attainable than a $1,500 one, if the salary behind it is strong enough.
Countries Where You Need To Work The Most to Buy 1 Square Metre Of Property
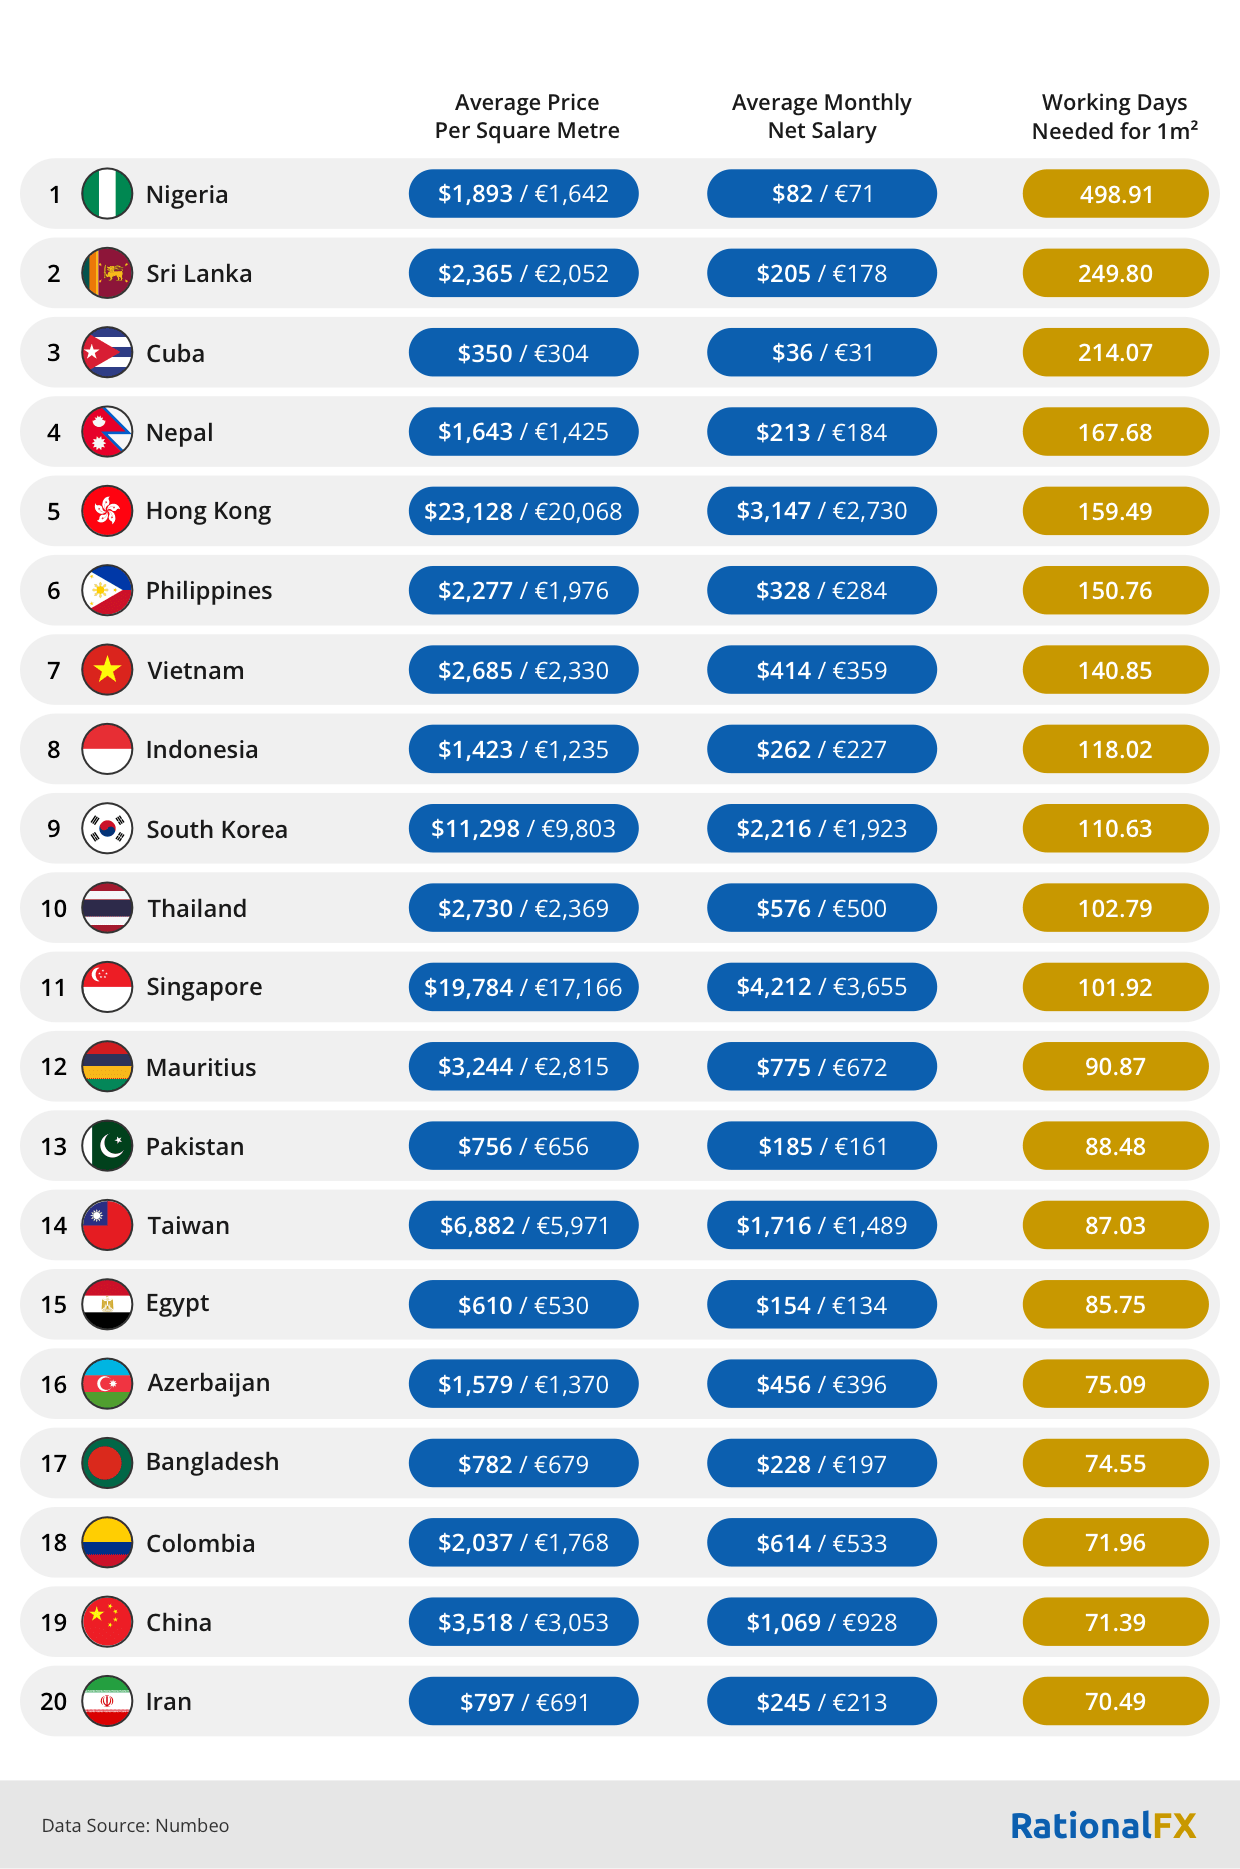
At the far end of the scale, the numbers reveal a strange inversion of the usual property story: cheap homes can still be wildly unaffordable. Cuba has the lowest average property price in this group at just $350 per m², yet that square metre consumes 214 working days because the average monthly salary is only $36. Nigeria takes the idea to an extreme, where a $1,893 square metre represents almost 499 working days – more than two years of work, if one has a standard five-day working week. Here, the obstacle is not the price of the property in isolation, but how little purchasing power sits behind each pay cheque.
Elsewhere, it is the sheer value packed into a single square metre that changes the equation. Hong Kong averages $23,128 per m², meaning one square metre costs more than seven monthly salaries, while Singapore and South Korea each demand roughly four to five months of income. A square metre may sound like an almost trivial amount of space, but in these markets, it carries a price tag closer to a major financial commitment, showing how something as small as the floor beneath a dining chair can represent months of someone’s working life.
How Much ‘Space’ Can Your Monthly Salary Buy You in Different Countries?
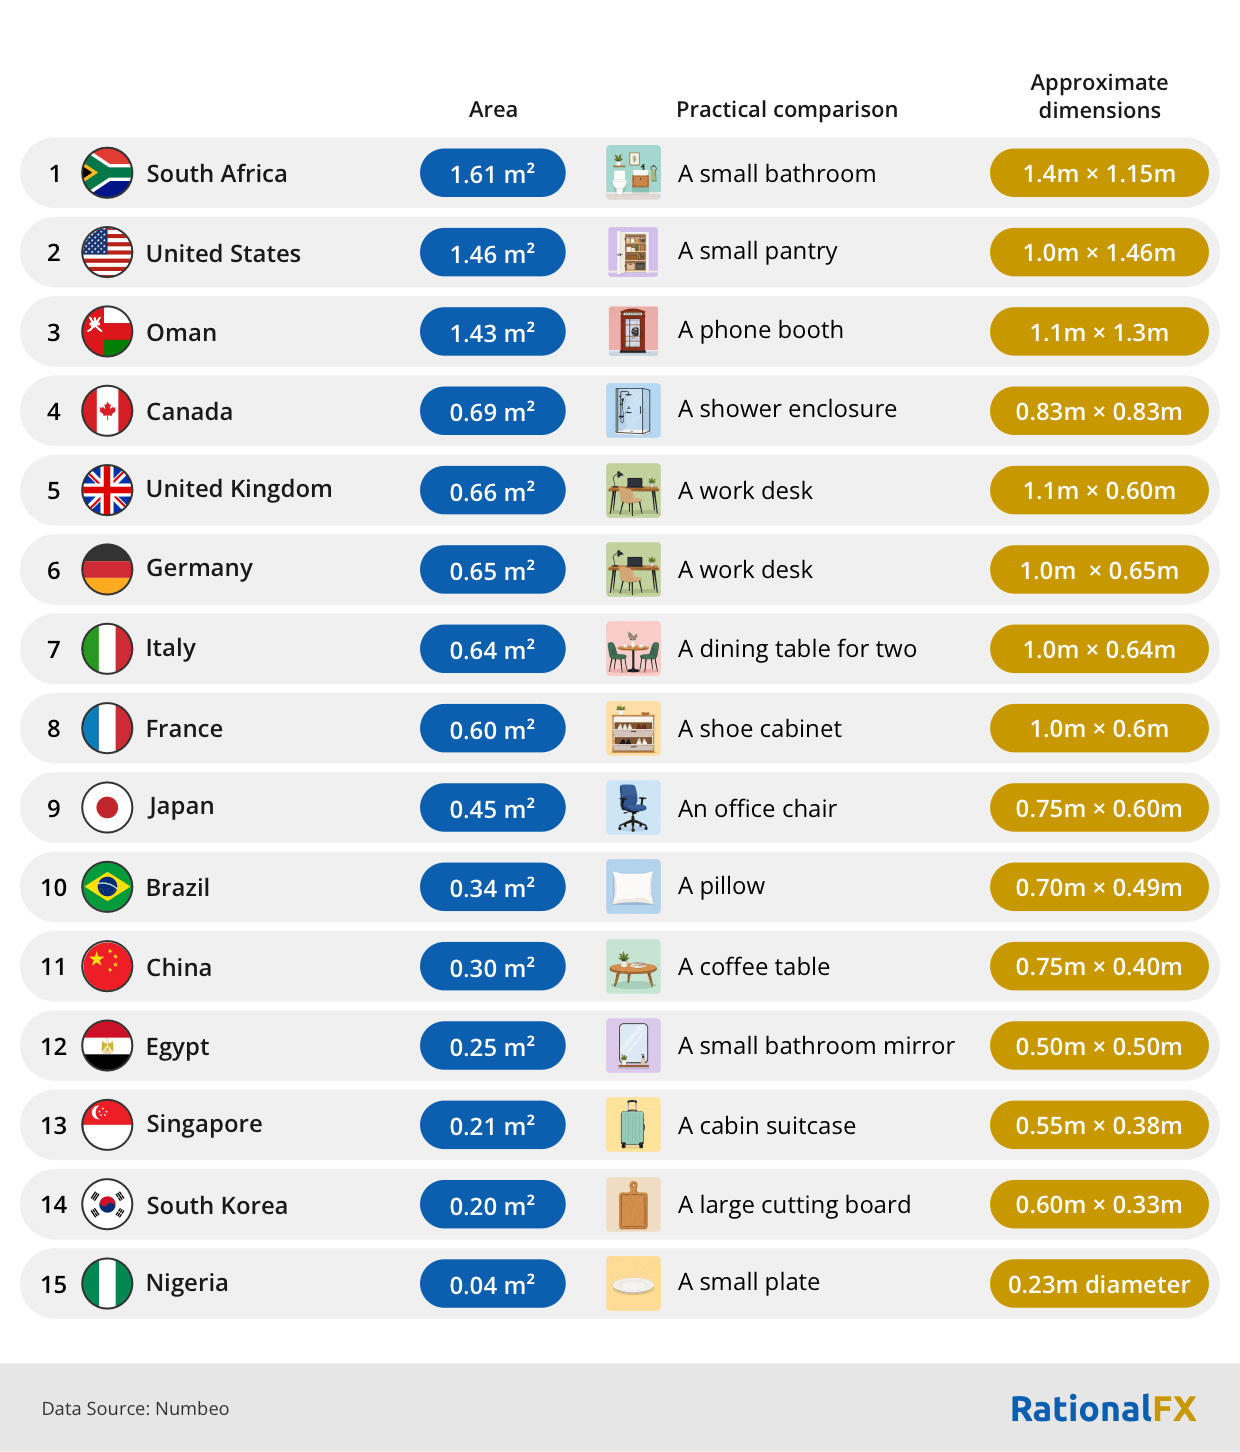
There is something almost surreal about translating a monthly pay cheque into mundane objects we barely notice in everyday life. Instead of asking how much you earn, imagine being handed a tape measure and told: this is what a month of work is worth. In South Africa, it is enough to cover the footprint of a small bathroom; in the US, a compact pantry; and in Italy, roughly the space occupied by a dining table for two. Further down the scale, that month of work shrinks to an office chair in Japan or a bathroom mirror in India – everyday objects that make the differences in purchasing power surprisingly easy to picture.
At the narrowest end, the comparison becomes almost absurd. In Singapore, a monthly salary amounts to roughly the footprint of a cabin suitcase, while in Nigeria it is just 0.04 m² – about the size of a dining plate. The objects may be small, but they expose a very large divide: the same unit of working time can cover somewhere to sit and eat in one country, but barely enough space to put down your breakfast in another.
Methodology
The analysis uses residential property and salary data from Numbeo, a global database that combines user-contributed information with data collected from authoritative sources and applies statistical filters to identify and remove anomalous entries. Numbeo describes its database as continually updated, with new contributions added regularly, while older data is archived according to availability and recency. All property price and salary data used in this analysis were collected on 13 August 2026 to provide a consistent snapshot.
For each country, we used Numbeo’s prices per square metre in the city centre and outside the city centre, then calculated the simple average of the two to produce the average property price per square metre used throughout the analysis. Salary figures represent Numbeo’s average monthly net salary after tax. All data was collected in US dollars and converted into euros using the exchange rate of $1 = €0.86768231 on 13 August 2026.
To measure the amount of working time required to purchase one square metre, we used the average monthly net salary to derive daily and hourly earnings, then compared these earnings with the average property price per square metre. We also calculated how many square metres could be purchased with one average monthly net salary. These calculations are intended to illustrate the relationship between local earnings and residential property prices rather than represent the actual cost of purchasing a specific property, which can vary considerably by city, neighbourhood, property type and other factors.
As Numbeo is a crowdsourced database, its figures should be understood as ‘indicative benchmarks rather than official national statistics’. Numbeo states that country-level figures are calculated from data across cities and that its system uses automated and semi-automated filters to reduce erroneous or anomalous submissions.